Factsheet 3 : Context of Educators in South African Public Schools
DATE: 20 June 2005
AUTHOR: Sue
Factsheet 3 : Context of Educators in South African Public Schools
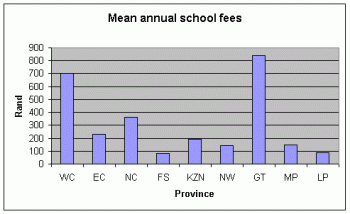
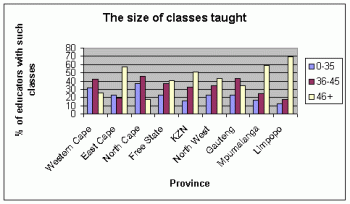
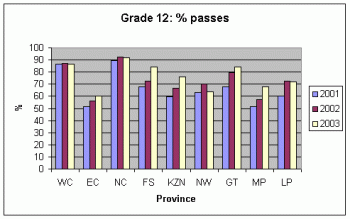
Key findings: There are major variations in the mean annual school fees, with the Free State charging the least (less than R 100 per child per year) and Gauteng charging the most (more than R 800). The average class size is lowest in the Northern Cape and Western Cape, with mostly fewer than 35 learners, while 70% of educators in the Limpopo Province and 60% in Mpumalanga Province had average class sizes of more than 45 learners. An analysis of matric results shows that Western Cape, Northern Cape and Gauteng have obtained higher overall matric pass rates in recent exams than the Eastern Cape, KwaZulu-Natal and Mpumalanga.
Results
This report examines factors at school level that affect teaching and learning in terms of factors outside the class room (annual school fees); factors within the class room (class size, formal contact hours); and school performance in terms of matric results.
Factors outside the class room (annual school fees)
Figure 1 gives an indication of provinces with average annual school fees. Gauteng, Western Cape and Northern Cape have higher average annual school fees compared with Eastern Cape, KwaZulu-Natal and Mpumalanga. The first three provinces with high annual school fees have relatively low HIV-AIDS prevalence (less than 6%), whereas the other three provinces with low school fees have an HIV prevalence of more than 13% with KZN at 21.7%. This should not be interpreted as saying that there is a link between school fees and HIV/AIDS status, but rather that schools with a high incidence of HIV/AIDS and poor financial resources are faced with serious educational challenges.
Figure 1
Factors within the class room (class size)
The class size was calculated by looking at the average number of learners in each class, as reported by the teachers. The table below indicates that Limpopo is the province with the largest class sizes. Almost 70% of the sampled teachers in Limpopo province reported to be teaching classes with about 46 learners.
Mpumalanga province has the second largest class sizes, with 60% of the teachers indicating that they are teaching classes with on average 46 learners. In contrast, a large percentage of teachers in Northern Cape and Western Cape indicated that they are teaching classes with less than 35 learners (Figure 2).
Figure 2
An analysis of Table 1 below suggests that 58% of African educators teach classes with about 46 learners. On the other hand, only 5.1% of white educators teach classes with between 36-45 learners. A significant number of coloured teachers (29%) also teach large classes. The majority of Asian teachers (57.93%) teach classes with between 36-45 learners. Only 23.62% of Asian teachers teach classes with 46 learners and more.
Table 1: Class size by race
|
||||||||||||||||||||||||||||||||||||||||||||||||||||||
School performance in terms of matric results
Figure 3 shows that Northern Cape is one of the provinces that has been consistently getting higher percentage passes in matric results, about 91% over the three year period. The second province that continues to get higher pass rates is the Western Cape, with about 86% within the three-year period identified in this study. The province that got lower matric results thorough the three-year period is Eastern Cape with a pass rate of around 55%.
Figure 3: Matric Results by Province
Recommendations
A multi-pronged approach involving different government departments should be worked out to improve financial bases of poor communities.
The business sector should be encouraged to support schools in poor neighbourhoods, and financially secure families in poor communities should be encouraged to significantly contribute to school finances.
Districts with poor matric results, large classes and inadequate finances should be prioritized in government intervention programmes to improve education.
A study of class room practice to develop models of good practice.


