High-performing learners also need support
South Africa’s participation in the Trends in International Mathematics and Science Study (TIMSS) has enriched our understanding of the South African education landscape. An analysis of our grade 9 results shows improvement, an indication that targeted interventions focusing on poorly performing schools and learners are having a noticeable effect. However, our high-performers might need more support, writes Dr Mariëtte Visser.
South Africa is still among the lowest-performing countries that participate in the Trends in International Mathematics and Science Study (TIMSS), however, it is encouraging to note that from 2003 to 2015, the country has shown the biggest positive improvement of all participating countries in both mathematics and science. Over this period, our average mathematics and science achievement scores increased by 87 and 90 points respectively, the equivalent of two grade levels. This indicates that our competency levels in mathematics and science have improved steadily over time.
Since 1994, the Department of Education and subsequently the Department of Basic Education (DBE) have implemented a number of policies, including pro-poor initiatives to promote equity and improve the quality of education in previously disadvantaged schools. This includes the introduction of the National Curriculum and Assessment Policy Statement (CAPS) in 2012 and the implementation of the policy on learning and teaching support material (LTSM) that supports the provision of core LTSM to schools. These materials comprise textbooks or learner books, workbooks and teacher guides – all considered important for the implementation of the curriculum.
Addressing policy
In South Africa, where the majority of children live in poverty, lack of money can be a barrier to schooling. In 2007, the government introduced no-fee schools to make it easier for low-income households to send their children to school, which resulted in improved school enrolment. Almost all the learners from low-income households are receiving a government-funded school lunch under the national school nutrition programme. Other interventions such as the alcohol and drug prevention and management programme, the care and support for teaching and learning programme, and the integrated school health programme have also been implemented.
In addition, through the accelerated schools infrastructure delivery initiative, schools that had been constructed from inappropriate materials are being replaced to provide an optimum environment for learning and teaching. This initiative also aims to address the basic safety norms backlog in schools without water, sanitation and electricity. Further support provided by government to the indigent include the social grant programme, the low-income housing subsidy; municipal rates rebates and free basic water and electricity. |
Competency levels
The TIMSS reports achievement at four points along a scale as international benchmarks. These cut-off points are: advanced (≥ 625 score points), high (≥ 550 and < 625 score points), intermediate (≥ 475 and < 550 score points), and low (≥ 400 and < 475 score points). The benchmarks are associated with identified capabilities of knowing and applying of content knowledge as well as reasoning abilities. Learners, who have not reached the low international benchmark, are seen as not yet competent in the subject at a particular grade level. For South Africa, another benchmark group was added for scores ranging from 325 to 399, and is referred to as the potential group. We believe that, although learners who fall in this group are not competent yet, with focused and structured classroom intervention, they can become competent and perform above the minimum competency level.
The TIMSS findings
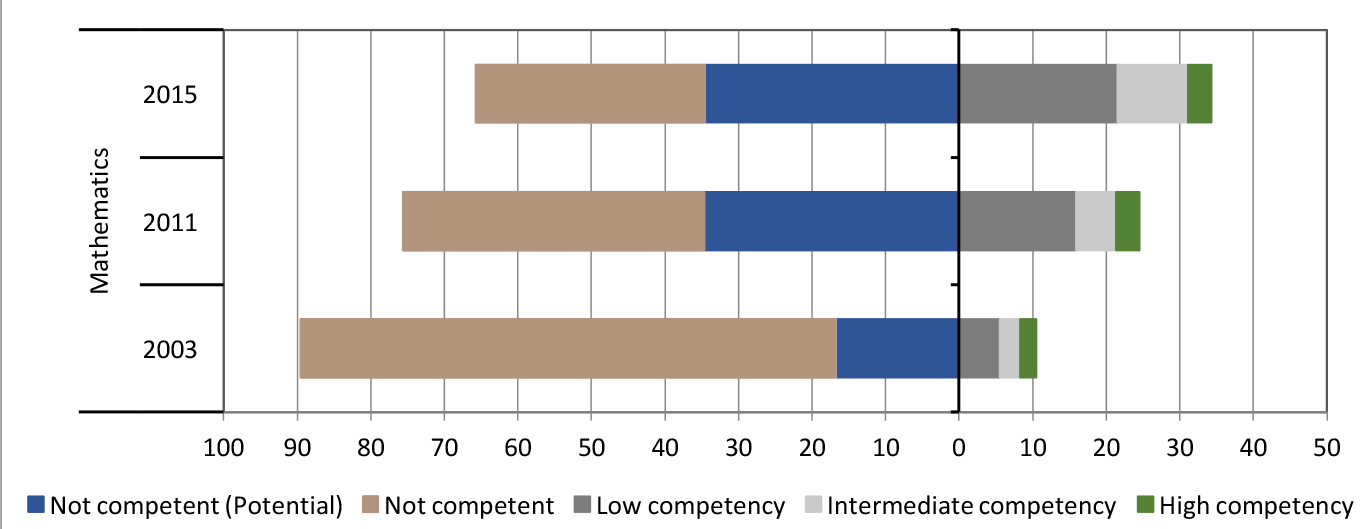
Figure 1 presents the percentage distribution of South African grade 9 learners by competency level in mathematics. The patterns for mathematics and science are similar. The figure illustrates how competency levels have improved from 2003 to 2015. The percentages of learners performing at the high and advanced international benchmarks have been combined in Figure 1 in the category of high competence.
There were significant shifts in competency level between 2003 and 2015. In Figure 1, these are indicated by the shift of the bars to the right, over time. For instance, in 2003, only 10% of learners were competent in mathematics, and the percentage increased to 34% in 2015. Additionally, in 2003, 13% of learners were competent in science, and this increased to 32% in 2015.
When looking at the lower end of performance, one notices an increase in the group of potential learners. The percentage of learners in the potential group doubled from 2003 to 2015. Increases of 17 percentage points and 13 percentage points were observed for mathematics and science, respectively. Another significant result is the dramatic decrease in the percentage of learners performing below 325 average score points. For mathematics, this percentage decreased from 73% to 31%, and for science it decreased from 72% to 40%.
Vast inequality
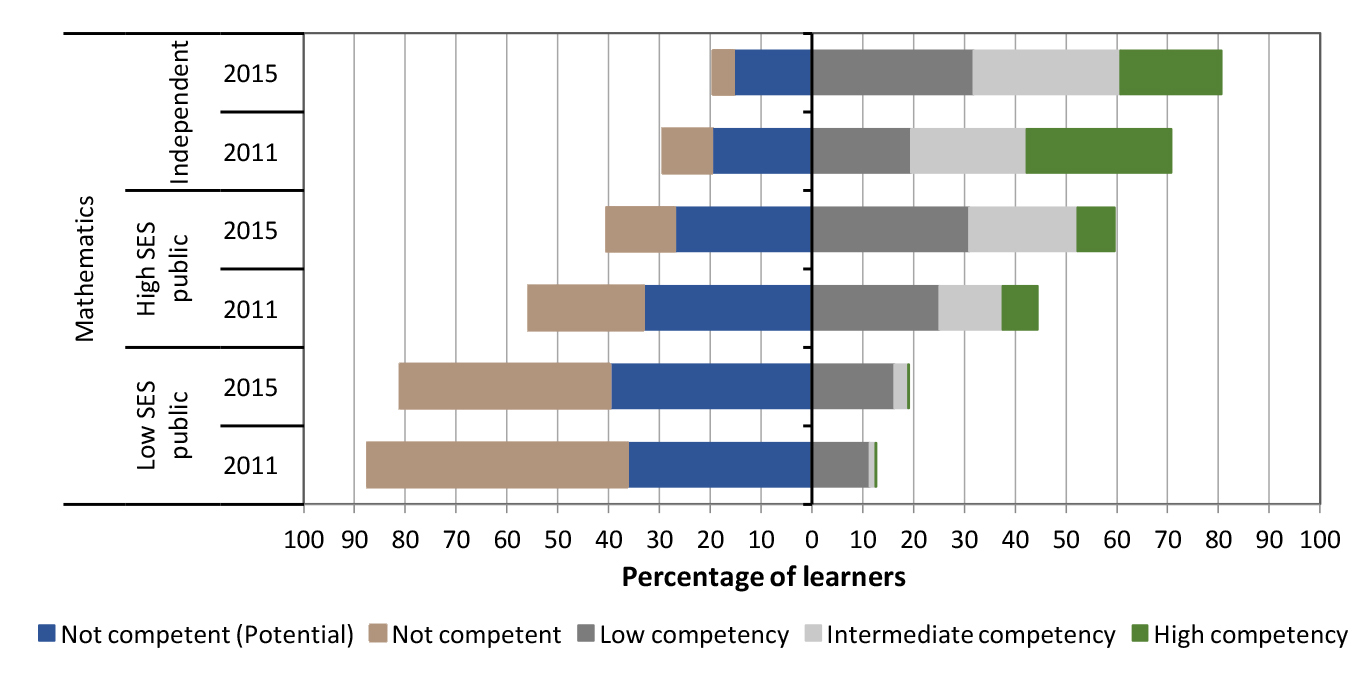
When the achievement scores are broken down by the socio-economic status (SES) of the school, the patterns reveal vast inequalities. In Figure 2, the distribution of learners by competency levels in mathematics and by school SES is compared for 2011 and 2015. The graph shows that within our public school sector we clearly see the inequality divide between low and high SES schools.
The analysis shows that, in 2015, approximately 80% of learners attending independent schools; 60% of learners at high SES public; and 20% of learners at low SES public schools achieved mathematics and science scores above the minimum level of competency. The percentage points increase (from 2011 to 2015) in the percentage of learners who achieved above 400 score points in mathematics were 6 for low SES, 15 for high SES and 10 percentage points for independent schools. Thus, high SES public schools had the largest improvement in learners who achieved at or above 400 score points. On the other hand, low SES schools had the largest improvement at the lower achievement levels with a reduction of 10 percentage points of learners who achieved below 325 score points.
Within this unequal performance, it is also worth noting that in 2015, 3.2% of South African mathematics learners and 4.9% of science learners achieved mathematics and science scores at the high level of achievement, which is a score of at or above 550 points. This is higher than other lower-performing countries.
Conclusion
Substantial improvements in the potential group, but slight improvements in the high-performers were noted. Achievement gains among lower performing learners show that targeted interventions focusing on poorly performing schools are having a noticeable effect. However, performance at the higher end is a concern. The groups of learners with high competence in mathematics and science do not seem to increase sufficiently to sustain and improve excellence in the education system. From 2003 to 2015, there were increases of only one to two percentage points. Experts believe that a country’s academic performance in subjects related to science, technology, engineering and mathematics indicates the future economic strength of that country. It is therefore important that the DBE also invest in interventions aimed at supporting high-performing learners towards advanced levels of excellence.
Author: Dr Mariëtte Visser, a senior research manager in the HSRC’s Education and Skills Development research programme
mmvisser@hsrc.ac.za
CLICK ON IMAGE TO ENLARGE
FIGURE 1: PERCENTAGE OF LEARNERS BY COMPETENCY LEVEL IN MATHEMATICS FROM 2003 TO 2015
CLICK ON IMAGE TO ENLARGE
FIGURE 2: PERCENTAGE OF LEARNERS BY COMPETENCY LEVEL IN MATHEMATICS AND SCHOOL TYPE, 2011 TO 2015