A new picture of early achievement in South Africa
In 2015, against a policy landscape that increasingly places early childhood development at the heart of educational reform and strategies to reduce poverty and inequality, the Trends in International Mathematics and Science Study (TIMSS) was administered for the first time at the grade 5 level. It found that three in five learners do not exhibit the required minimum level of basic mathematical knowledge. Dr Kathryn Isdale reports.
Since 1995, South Africa has participated in five TIMSS cycles, charting the slow and steady improvement of grade 8/9 learner performance. But grade 9 is a long way into the educational system and disparities that exist there are often the product of years of compounding inequalities across the system, often beginning before children enter the classroom. Exploring patterns in educational achievement earlier on in the grade system is vital to gaining a better understanding of how and when inequalities manifest and how they might be tackled by policy reform and targeted intervention.
One of the lowest performers
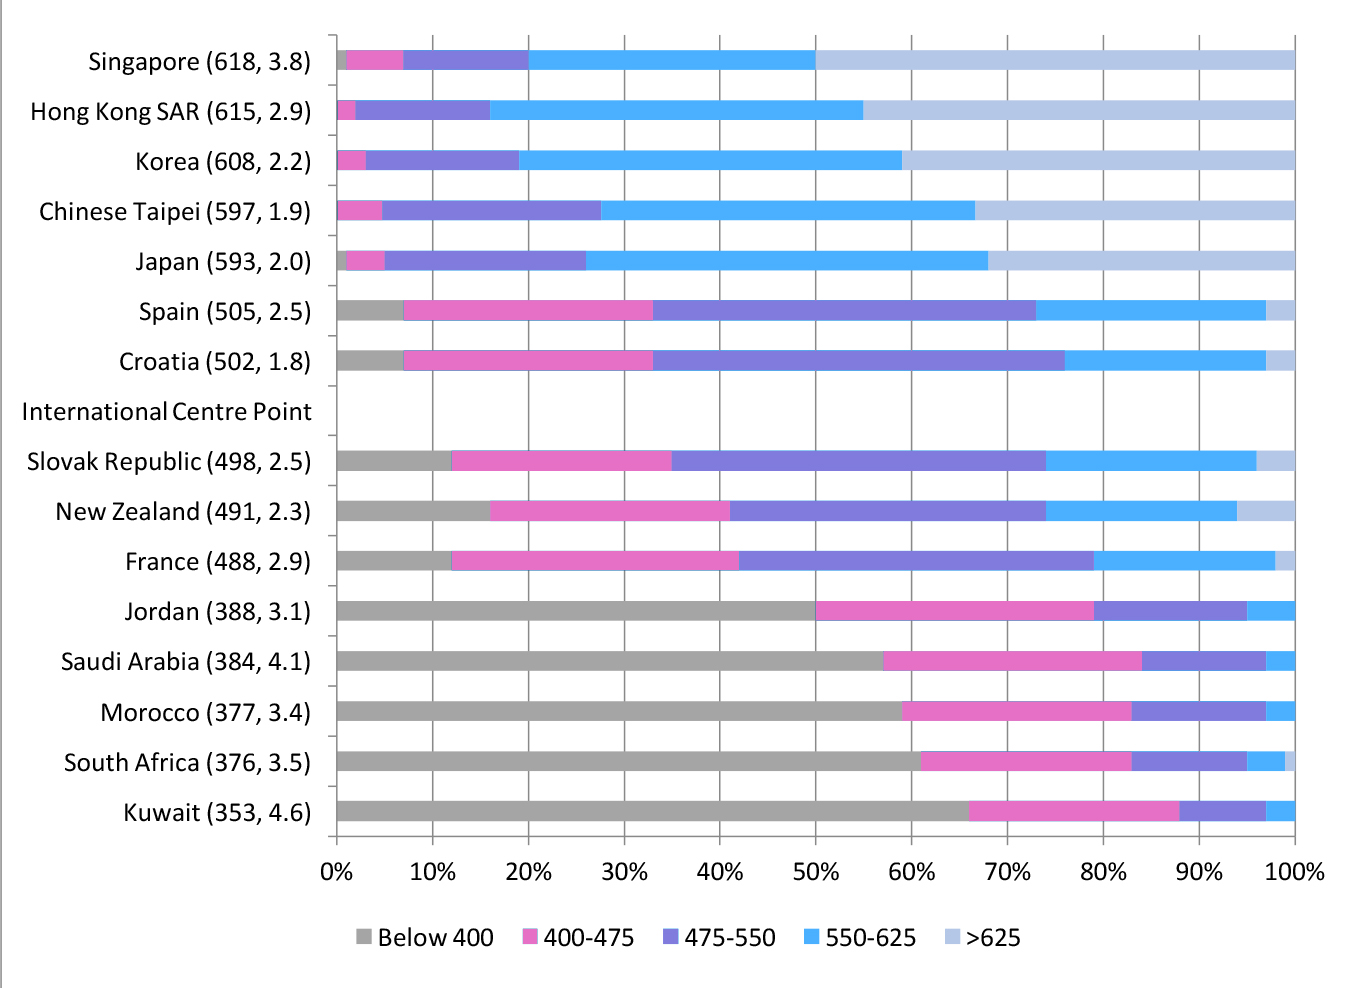
TIMSS assesses the mathematics achievement of learners in grade 4 or 5 across 49 countries, comparing average scores and proportions of learners at different points in the achievement distribution using established performance benchmarks, the lowest of which is 400 - 475 points. However, with a national average of 376 points, South Africa is one of the lowest-performing countries with 61% of grade 5 learners not exhibiting the minimum competencies in basic mathematical knowledge required of grade 5. Figure 1 compares performance for a selection of participating countries: the five highest-performing countries, five around the TIMSS centre point of 500 points, and the five lowest-performing countries.
In the five highest performing countries – Singapore, Hong Kong SAR, Korea, Chinese Taipei and Japan – almost all learners scored above 400 points, the low benchmark set by TIMSS. All five countries have an average performance in the high benchmark, 550 - 625 points, and in Singapore half of all learners score at the advanced level, that is over 625 points.
The achievement profile of the five lowest-performing countries – Jordan, Saudi Arabia, Morocco, South Africa and Kuwait – shows that 50 - 65% of learners scored below 400 points. While South Africa is one of the lowest-performing countries, it is nevertheless promising to note that 1.3% of learners score in the advanced category. We stand out in this regard as none of the other bottom countries have learners performing at this level.
FIGURE 1: TIMMS 2015 AVERAGE SCALE SCORE IN MATHEMATICS, BY TIMMS BENCHMARCK IN A SELECTION OF COUNTRIES
CLICK ON IMAGE TO ENLARGE
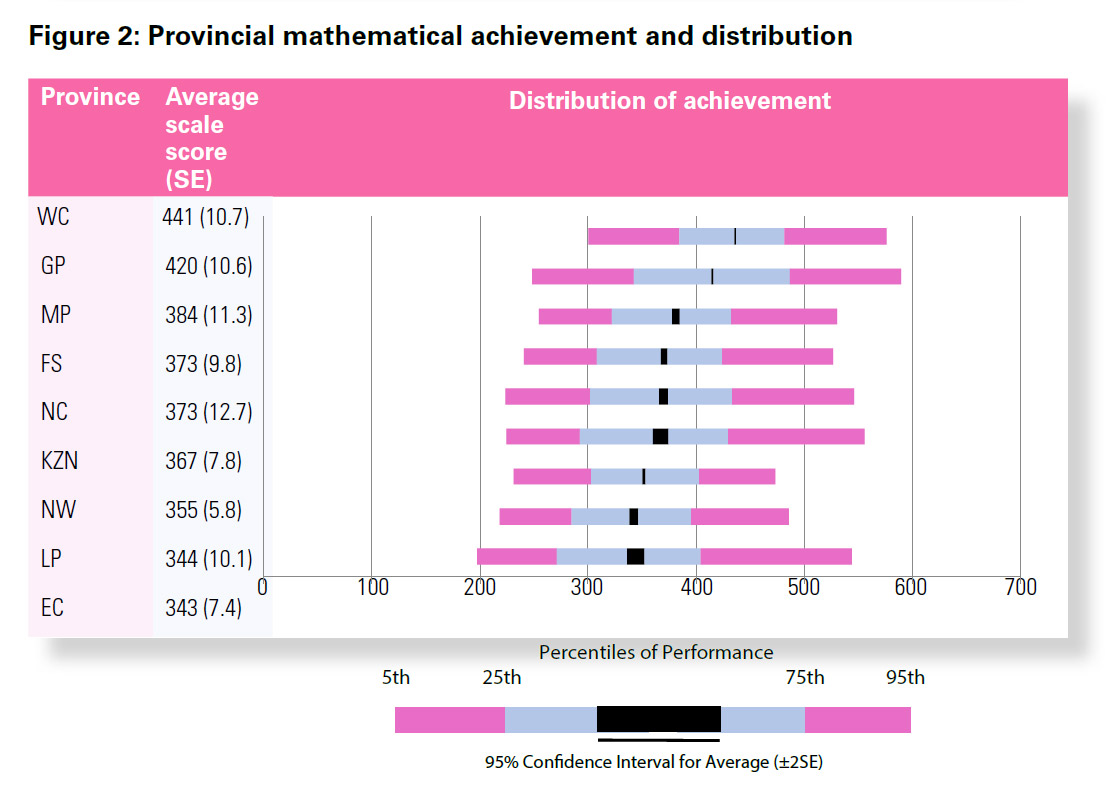
FIGURE 2: PROVINCIAL MATHEMATICAL ACHIEVEMENT AND DISTRIBUTION
CLICK ON IMAGE TO ENLARGE
Provincial achievement
Provinces can be clustered into three broad performance groups:
Higher (Western Cape and Gauteng)
Middle (Mpumalanga, Free State, Northern Cape and KwaZulu-Natal)
Lower (North West, Limpopo and the Eastern Cape)
Figure 2 describes the provincial mathematics achievement and distribution, showing the top-performing provinces of the Western Cape (441 points) and Gauteng (420 points) scoring, on average, above the TIMSS low-level benchmark but well below the centre point of 500 points.
Differences in average achievement by school type
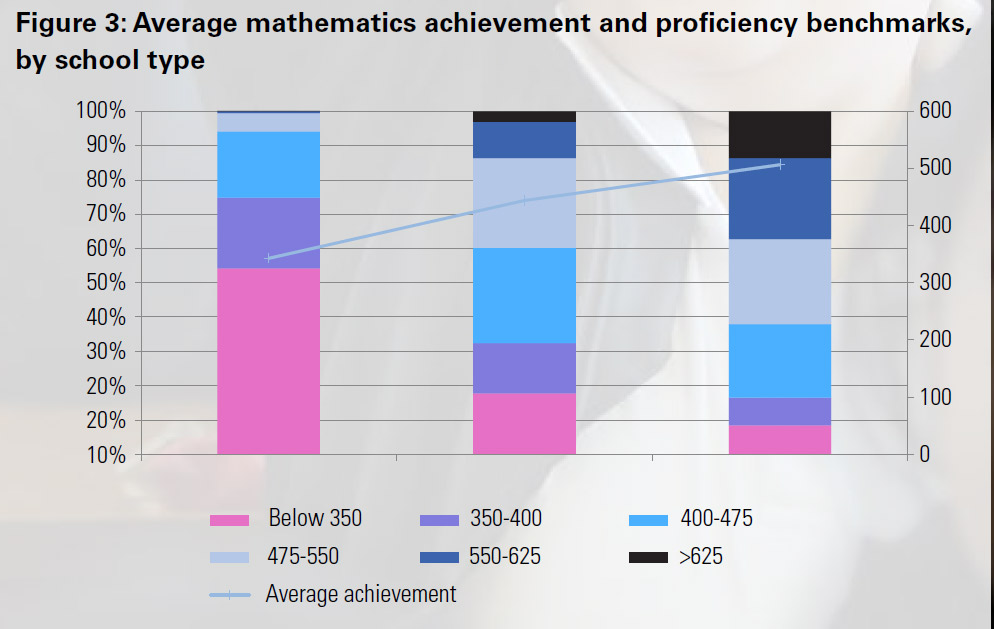
In the grade 5 TIMSS sample, 69.7% of learners attended public no-fee schools, with 26.7% in public fee-paying schools, and 3.6% in the independent sector, but when achievement is broken down by school type, the patterns further reveal the depth of inequalities in the system.
Figure 3 shows that learners in more affluent, better resourced schools score, on average, higher than those in no-fee schools with limited access to resources for teaching and learning. In public no-fee schools, the average score is 343 points, jumping over 100 points – a full standard deviation – to the average in fee-paying schools of 444 points. There is a further jump of 62 points to the small proportion of learners in independent schools who score, on average, 506 points, just above the TIMSS centre point.
In terms of performance benchmarks, approximately 84% of learners in independent schools, 67% of those attending public fee-paying schools and just 25% at public no-fee schools achieved the minimum level of competency.
FIGURE 3: AVERAGE MATHEMATICS ACHIEVEMENT AND PROFICIENCY BENCHMARKS, BY SCHOOL TYPE
CLICK ON IMAGE TO ENLARGE
Conclusion:
The results of our study retell the predictable story seen before in South Africa of advantage begetting advantage at one end of the distribution, and compounding disadvantage at the other. Provincially, there are large discrepancies in average levels of attainment and when broken down by school type, the depth of the problem is only amplified.
It is encouraging that nationally, just over 1% of learners achieved the TIMSS advanced level of more than 625 points, including a handful of those in no-fee schools. However, given the advantages afforded to most of these top performers, this proportion should be higher. Improving the academic performance and educational outcomes of South African learners requires a whole distribution shift, not just a pulling up at the very bottom.
The diversity in educational achievements throughout the system suggests differentiated strategies for those at different points on the achievement scale. For those at the lower end of the achievement spectrum, mostly no-fee schools, improved home resources and experiences alongside greater school resources can contribute to better achievement. For those performing at the higher end of the achievement distribution, mostly fee-paying and independent schools, the focus should be on improving in-school and in-class experiences, as well as challenging learners for excellence in performance.
Author: Dr Kathryn Isdale, HRSC honorary research fellow
kate.isdale@gmail.com