Designing new science, technology and innovation indicators for South Africa's developmental challenges
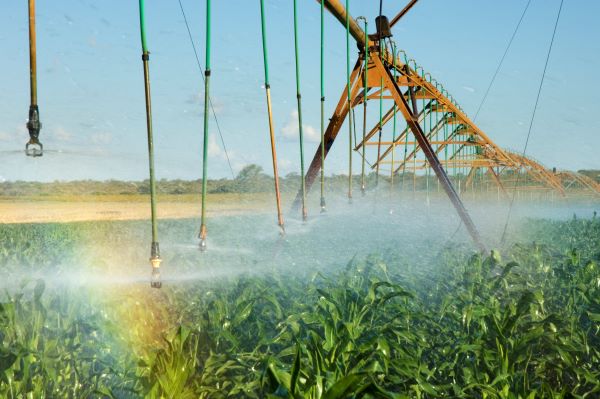
The agricultural sector is vital to eradicating hunger and promoting food security. Designing new indicators to measure agricultural innovation will help the government to target interventions to support the sector. Photo: Graeme Williams, Brand South Africa
The era of COVID-19 has sharpened our focus on harnessing science, technology and innovation (STI) to address our most demanding social and economic challenges. Researchers at the HSRC’s Centre for Science, Technology and Innovation Indicators (CeSTII) explore how indicators and STI measures can provide evidence to promote innovation for inclusive and sustainable development. By Glenda Kruss, Moses Sithole, Nazeem Mustapha, Il-haam Petersen, and Gerard Ralphs
Measurement of science, technology and innovation (STI) in South Africa is based on a global standard set by the Organisation for Economic Cooperation and Development (OECD), which is strongly influenced by highly developed economies. Over the past few years, the HSRC’s Centre for Science, Technology and Innovation Indicators (CeSTII) has grappled with maintaining the core OECD approaches for global comparability, while designing new measures and indicators more appropriate to the Southern African context.
To illustrate what is possible, we focus here on the African Union’s STI Strategy for Africa (STISA) goal to eradicate hunger and ensure food and nutrition security – a goal made more salient by the impact of COVID-19.
What measurement resources and data can we draw on to assess how well our STI system and activities are oriented to support this goal?
The most well-established trend data and the dataset most widely used in South Africa to measure STI is derived from CeSTII’s national survey of research and development (R&D), which strictly follows the OECD’s Frascati Manual, to measure the country’s R&D expenditure and personnel.
We can interrogate this data in new ways in relation to agriculture research fields, agricultural industrial sectors or agriculture-oriented R&D activity. For example, we can analyse the relative proportion of expenditure allocated to promote the socioeconomic goals of ‘plant and animal production and primary products’ and track the spend over time to identify areas for policy intervention. We can assess if the levels of expenditure are sufficient, relative to peer-country benchmarks or national policy commitments and which institutional sectors could potentially increase their proportional spend.
This, however, is only focused on the ‘input’ dimension of growing the potential of the national R&D system to create knowledge and technology targeted at the specific developmental challenge. This R&D data does not allow insight into how knowledge and technology are used to promote innovation and productivity in agricultural firms or to promote better public-sector support to the agricultural and food-security enterprise.
For this purpose, South Africa also has well-developed capacity to measure how firms innovate. The recently released Business Innovation Survey 2014–16 and baseline Agricultural Business Innovation Survey 2016–18 provide vital data on the scale of innovation, the nature of firms’ main innovation activities, the outcomes of innovation, and the factors that facilitate or constrain innovation at firm level.
How enterprises innovate in South Africa’s agricultural sector
The OECD’s Oslo Manual, on which innovation surveys are based, was initially designed to measure innovation activity in manufacturing firms and later extended to firms in the services sector. There is no widely accepted approach to measuring the nature of innovation in agricultural firms. CeSTII adapted the core innovation survey methodology to design and conduct a baseline survey of innovation in South Africa’s commercial agricultural firms.
The data show that a high proportion (61.7%) of agricultural enterprises reported being innovative, meaning they had introduced a new or significantly improved product, process, organisational method, or marketing method to their enterprise.
To identify policy spaces to improve innovation in agricultural firms, we need to understand the nature of this innovation, and valuable insight can be gained from disaggregating the different ways firms implemented and invested in innovation.
The data show that in aggregate, across the agricultural firms, the most common innovation activities in order were training; acquisition of new forms of equipment and machinery, computer software and hardware; and R&D.
The data also show that innovation-active agricultural enterprises adopted advanced technologies for innovation, such as precision agriculture technologies (49.4%), air and soil sensors (35.9%), and crop sensors (31.8%).
What stands out is the different patterns of innovation evident in the three main agricultural sub-sectors. Innovation in the fisheries sub-sector is more strongly focused on R&D, and 78% of firms adopted livestock biometric technologies. In the forestry sub-sector, innovation is focused more on upgrading technology and capability building, and firms are less likely to adopt advanced technologies; only 19.3% of innovation-active forestry businesses adopted smart breeding, drones and precision agriculture, for example.
Further policy-useful insights can be gleaned from analysing the most important barriers that agricultural firms reported as constraining innovation. Knowledge barriers related to capacity and skills suggest the need for collaboration with higher education, technical vocational education and training (TVET) colleges and science councils. The importance of resource factors such as access to land, water and finance underscores the importance of alignment with the policy objectives of the departments responsible for agriculture; the environment; and trade, industry and competition.
Analysing these innovation data trends raises new questions for STI policy, which must be addressed in coordination with other policy actors in agriculture.
Measuring innovation in informal-sector enterprises
In a highly unequal society like South Africa, there is considerable economic activity in the informal sector at the local level, where many individuals and micro-enterprises grow, prepare and sell food. This supports the goal of eradicating hunger, while creating livelihoods.
The distinctive experiences of economies of the Global South drive a growing recognition that innovation takes place not only in formal-sector firms, but also in a wide range of other settings.
CeSTII recently completed initial research to measure innovation in informal enterprises, given their important contribution to the livelihoods and survival of millions of South Africans. Such measurement is complex since national and regional informal business registers do not exist.
The most significant difference is that in the informal sector, economic activity is localised and typically takes place in small- and micro-enterprises, often with a single owner. Hence, innovation measurement needs a spatial lens and must be sufficiently fine-grained to capture the nature of economic and innovation activities in these enterprises.
A baseline innovation survey conducted in Sweetwaters, KwaZulu-Natal, provides useful new insights. The survey found that, in informal food-services, firms’ demand and supply is local: 44.3% of informal food-services firms reported that their customers and 59.8% of their suppliers were from the local neighbourhood. These firms were typically in the owner’s home (41.3% with and 21% without their own dedicated space) or in no fixed location (18.1%), some from a taxi rank (4.4%) or footpath (4.1%), and very few at a market.
In contrast to the 61.4% of commercial agriculture firms that reported being innovation active, a very high proportion (85.6%) of informal food-services microenterprises reported being innovation active, with 67.2% having reported product innovation and 81.5% process innovation.
The most frequent innovation activities reflect the prevalence of forms of local learning and capability building from customers and suppliers. The most frequently reported innovation activity was responding to customer demand, based on their feedback (71.7%) at the local level, followed by acquiring tools, machinery and equipment (56.2%) such as buying a fryer to sell hot chips. Finding new suppliers of raw materials and tools (50.2%) was also important. Suppliers are typically wholesale shops near the business locale, but businesses may source new suppliers from the nearest big city, or a cheap supplier in a larger metropole. Finally, a common innovation activity is ‘happy accidents’ – unexpected discoveries made during production (37.5%).
R&D or formal knowledge and technology-led types of innovation activity are used very infrequently, so the policy mechanisms driving these at the national level are not likely to be valuable to informal firms.
Sourcing of new forms of knowledge and technology in other ways by informal firms included searching for new knowledge (7.5%), bringing in know-how or other types of knowledge (7.2%), and using indigenous knowledge (7.1%). Innovation was also in the form of learning, through training staff (8%), on-the-job learning (4.1%), and formal apprenticeships (3.9%).
For these firms, which constantly sought ways to improve and diversify, barriers to innovation did not impact their innovation significantly. The factors we found that negatively impact informal firms point to opportunities for policy intervention by national and local government: to provide basic infrastructure, to offset high compliance costs, and to create new innovation-funding mechanisms.
Using existing data to create new indicators
By focusing on eradicating hunger and food security, we contend that new kinds of data can be used to interrogate the distinctive nature of innovation in different settings to raise new policy questions. Different ‘pictures’ of innovation emerge if we consider larger commercial or microenterprises, or enterprises based in urban economic hubs and major cities and those in peri-urban local areas, on the margins.
CeSTII’s new surveys contribute to efforts to expand STI indicators and create data to support the inclusive national system of innovation promoted in the White Paper 2019, and required to address our country’s major social, health and environmental challenges.
An all-encompassing range of new forms of STI measurement and indicators is needed and can be created with new analysis of existing R&D and innovation datasets and through the creation of new datasets.
Going forward, the exercise can expand to address other STISA developmental priorities and other settings. For example, we could examine how health R&D and innovation promote the goal of ‘preventing and controlling diseases and ensuring well-being’, or we could experiment with new measures of innovation in the public sector to address the goal of ‘living together and building society’.
The approach is of equal value for partners across sub-Saharan Africa as we strive to develop appropriate measurement models to achieve inclusive and sustainable development goals.
Authors: Dr Glenda Kruss, executive head, Dr Moses Sithole, research director, Drs Nazeem Mustapha and Il-haam Petersen, chief research specialists, and Gerard Ralphs, programme manager and policy analyst, at the HSRC’s Centre for Science, Technology and Innovation Indicators (CeSTII)